
Location
The road-accessible Zinger Property is located 24 km west of Cranbrook, British Columbia and covers 10,000 hectares over a 20 km strike length of favourable geology with gold and copper deposit potential.
History
The 1860’s gold rush brought thousands of people to the Cranbrook area to placer mine the creeks for gold. To this day, small scale placer operations can be found along Perry Creek. Anecdotal data suggest that the Zinger Property was likely explored by prospectors for the bedrock source of the placer gold found in the creek as far back as the mid-1800s.
The earliest recorded work on the property was in the period between 1915 and 1921 on the Yellow Metal prospect.
Prospecting, geological mapping, soil geochemistry, and geophysics have since been carried out over various parts of the large Zinger Property. Sections of the property have been worked by a number of companies including Gallant Gold Mines Ltd. (1981),Trans-Arctic Exploration Ltd. and Fort Steele Grubstaking Syndicate (1985), Partners Oil & Minerals Ltd. (1987), Unique Resources (1987), Consolidated Ramrod Gold Corp. (1992), and National Gold Corp. (2000).
In 2003, Chapleau Resources Ltd. carried out rock grab sampling, soil geochemistry, and 20 diamond drill holes in localized areas. Hole Z-03-16 returned the best result of 0.484 g/tonne over 17.5 m. Limited trenching and geology was done by SG Spirit Gold Inc. (formerly Ruby Red Resources Ltd.) in 2009.

Exploration Potential
Since the beginning to consolidate mineral title to the Zinger Property, PJX has compiled historical data, identified data gaps and infilled those gaps with mapping, prospecting, soil and rock geochemical surveys, airborne and ground geophysical surveys, and targeted drilling campaigns. This work has increased our knowledge of the geological controls on mineralization, the type of deposits we plan to discover, and the land ownership required to properly explore the targets.
Two large areas, each with multiple targets to explore, have been identified to date. The South target area has orogenic type gold mineralization, and the Northwest target area has intrusive related gold and copper mineralization potential – see map. Additional gold and copper mineralization potential exists outside these two areas on the property. These other areas are at a less advanced stage of exploration.
South Target Area
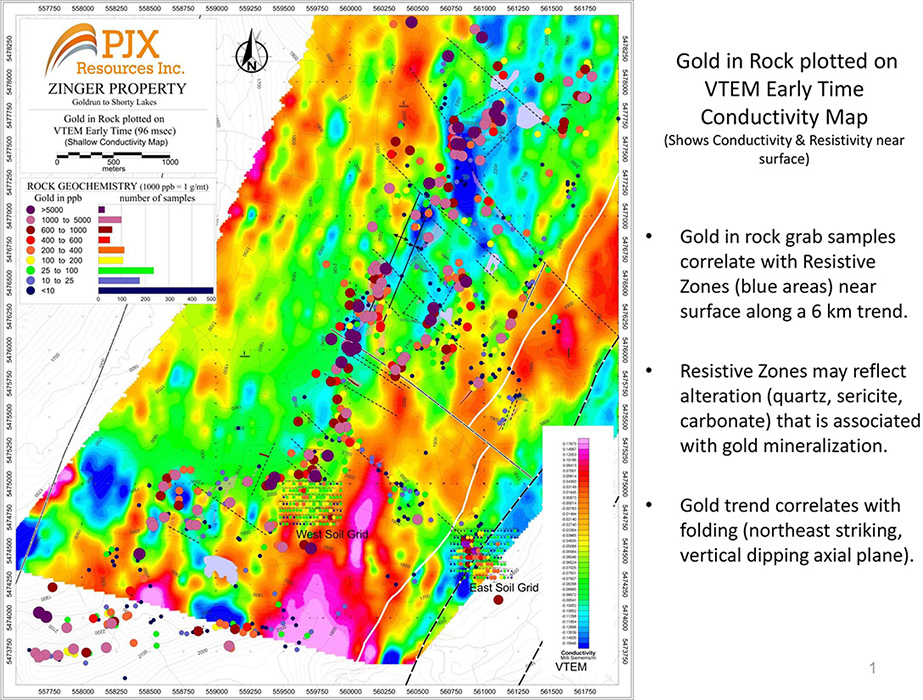
Gold in rock grab samples associated with quartz-sericite-carbonate veining can be traced for over 6 kilometres. Gold values range from being anomalous to over 30 g/t.
Gold trend appears to coincide with the first phase of folding (“F1”) where open to relatively tight north-northeast (“NNE”) striking folds have axial planes dipping sub-vertical to steeply west. Gold mineralized veins are hosted in sericite-carbonate altered Proterozoic aged Creston Formation quartzites, argillite, and siltstones.
Northwest (“NW)” trending faults cut the fold structures. Alteration (sericite-carbonate-quartz) mineralization locally extends south-southwest (“SSW”) from these NW-trending fault structures along the folds. These extensional faults appear to have served as conduits for up-flow of mineralizing hydrothermal solutions.
Gold also occurs with veining and alteration associated with a second phase of folding (“F2”) that strike NNE, similar to F1, but have shallow southeast dipping axial planes that dip sub-parallel with the terrain slope.
Intersection of F1 and F2 folding may influence the location of higher gold grades.
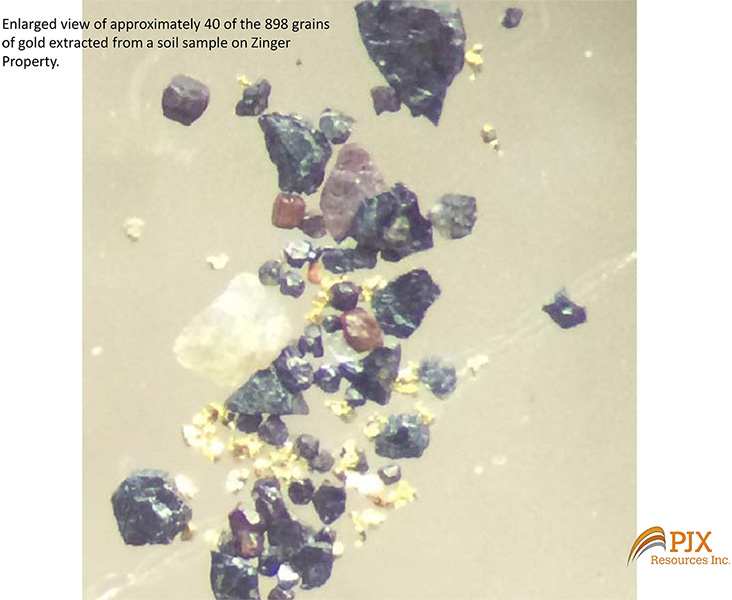
High gold values in soils occur locally. Two soil grids (East and West grids) have gold values ranging up-to 4,941 ppb (4.941 g/t) gold in the soil.
Early Time VTEM airborne survey conductivity data suggests surface gold mineralization appears to be associated with resistive zones that could reflect quartz flooding and veining.
Late Time VTEM data shows the geophysical signature of rocks at depth and suggests that a larger resistive zone occurs at depth and may reflect an area with increased F2 folding and a possible increase in gold mineralization. Where this larger resistive zone intersects F1 folding at depth is one of the future exploration targets in the South target area on the Zinger Property.
VTEM Earl Time

VTEM Late Time
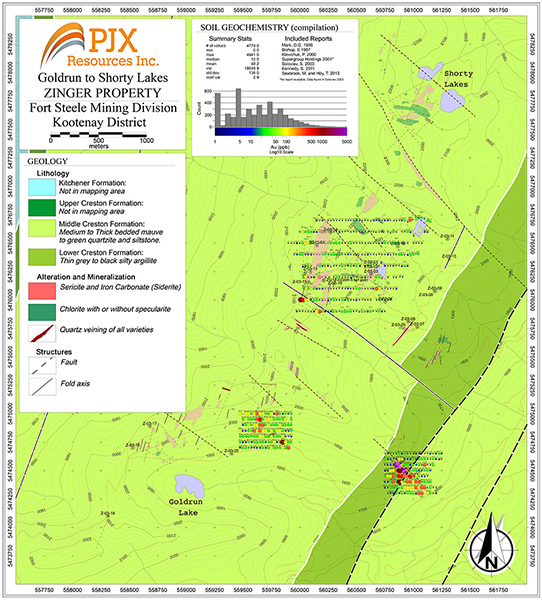
Zinger Map geology-Soils

Gold Run Lake – West Grid gold soils
Gold Run Lake – East Grid Gold Soils – 2

Gold Run Lake – East Grid Gold Soils – 1

Zinger Stacked Profile Line 4550

Zinger Series of Stacked Profiles – 2

Zinger Series of Stacked Profiles – 1

West Grid Gold in Soil

Stacked VLF and Gold Soil Profiles – 1

Stacked VLF and Gold Soil Profiles – 2

West Grid VLF Anomaly Maps
Northwest Target Area
Intrusive related gold mineralization occurs along a 10 km trend on this part of the Zinger Property. Three primary targets have been identified to date. They are the Gar, North Gar and PGC (Porphyry Gold-Copper) targets.
Gar Target
Grab samples of quartz veins in a granitic intrusion returned gold values ranging from anomalous to 28,841 ppb (28.84 g/t) gold.
A pre-PJX historical 1,600 m long gold in soil anomaly occurs over the Gar Intrusive. The intrusive is largely covered by overburden and has not been drill tested.
The style of gold mineralization may be similar in type to the Fort Knox gold deposit in Alaska. Fort Knox and the Gar intrusive target both have visible gold that occurs in sheeted and other veins within Cretaceous age granite that intrudes Proterozoic age sedimentary rocks. Veins in both areas are influenced by regional structures. Sulphide content of veins is low in both the Fort Knox and the Gar intrusives, and gold mineralization is associated with elevated bismuth, molybdenum and tungsten. Associated hydrothermal alteration is not significant in either area. Fort Knox’s host intrusive has a surface exposure of approximately 1100 by 600 meters, comparable to the Gar intrusive target area of approximately 1200 by 500 meters.
Kinross Gold Corporation’s web site reported that in 2019 “Fort Knox produced its 8 millionth ounce of gold, over 20 years into its mine life.”
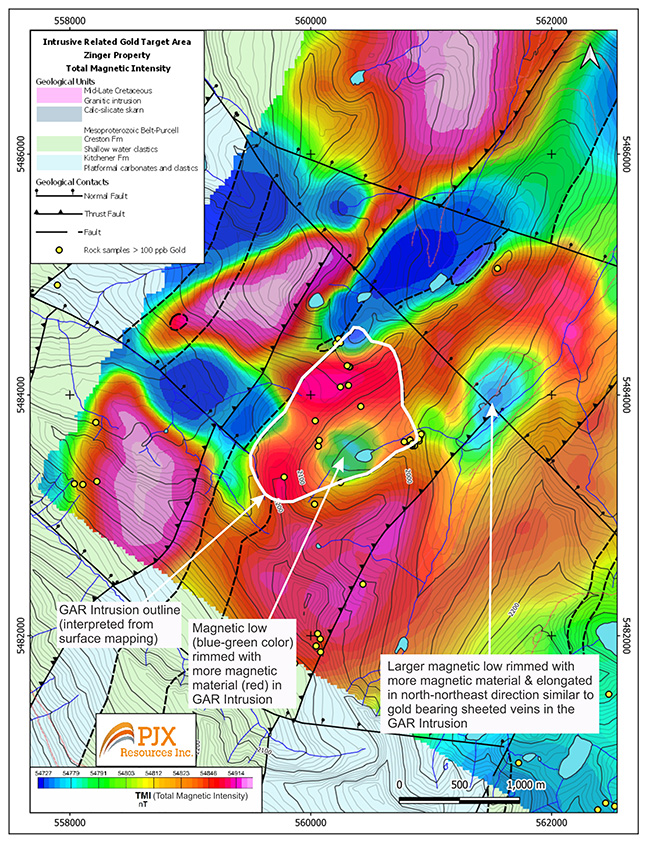
Gar North Target
Airborne geophysical survey flown by Expert Geophysics has defined a magnetic low core to the GAR intrusive rimmed by more magnetic material. A large magnetic low rimmed by more magnetic material has been identified adjacent to the GAR intrusive and may represent a second large gold mineralized intrusion. This Gar North target has an elongated shape trending north to northeast which is similar in orientation to gold bearing sheeted veins in the GAR intrusive and the local large synclinal fold axis.
PGC (Porphyry Gold-Copper) Target
Expert Geophysics’ 3-D inversion and interpretation of airborne magnetic data has identified a donut shaped anomaly that resembles the magnetic signature for a type-example of a gold-rich copper porphyry deposit as shown in CSIRO’s (Australian government Commonwealth Scientific and Industrial Research Organisation) slide below.
The PGC target’s distinctive donut shaped magnetic signature supports it being a possible different phase of intrusive from the Gar intrusive with gold mineralization to the south, and the Leader granitic porphyry intrusive with gold and copper occurrences called the Leader and Dug-Dug to the north.
Leader occurrence – gold, silver, lead, and copper mineralization occur with quartz veining in a shear in sediments adjacent to the Leader intrusive. The narrow (0.15 to 1.5 m wide) vein was identified by historical surface trenching and/or underground workings for approximately 600 m along strike in the 1930s. PJX grab sample of mineralized quartz vein material in 2021 analyzed 10,226 ppb (10.2 g/t) gold, 107 ppm (107 g/t) silver, 2.56% copper, and greater than 10% lead.
Dug-Dug occurrence – shear hosted quartz veins with gold and silver mineralization occur within the Leader stock. One of four holes drilled by Ruby Red Resources in 2007 intersected 2.91 g/t gold, 394 g/t silver, 2.94% lead, and 3170 ppm (0.31%) copper over 1.27m from 33.2m-34.47m down hole.
The Leader and Dug-Dug occurrences are not primary targets. The PGC target may be a gold-rich copper porphyry that has intruded adjacent to the Leader intrusive and is a more significant target. Gold, copper and other mineralization in the Leader and Dug-Dug occurrences support the potential that the PGC target may host gold and copper mineralization.
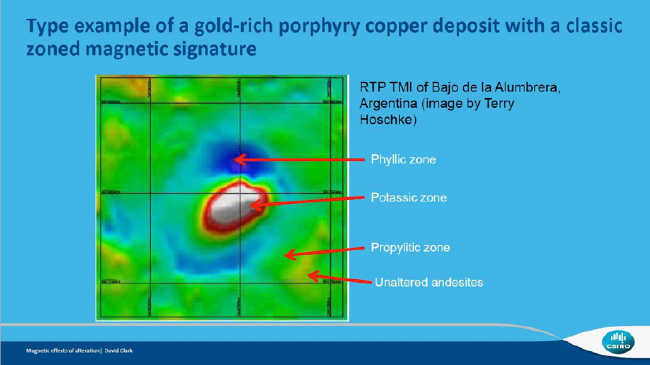
CSIRO (Australian government Commonwealth Scientific and Industrial Research Organisation) type-example for a Porphyry gold-copper deposit with zoned magnetic signature. Zonation in alteration and mineralization within and around the porphyry can produce a somewhat donut shaped magnetic anomaly. The central mag high (red area) reflects a potassic altered zone with gold, copper, and magnetic mineralization. The central mag high is encircled by a mag low (blue area) that reflects a phyllic altered zone, and this produces a somewhat donut shaped anomaly.

PJX’s Porphyry Gold-Copper (PGC) target has a typical porphyry gold-copper signature with a central mag high (red area) encircled by a donut shaped mag low (blue area).

Apparent Conductivity (33 Hz frequency) displays a large low conductivity anomaly (blue area) at depth. The large conductivity low may represent an intrusive body at depth that was the original magma source with multiple pulses of magma to form intrusive offshoots, such as the Gar granitic intrusive, and the Gar North and PGC Targets with their near surface outlines shown on the map.

The Gar and Leader intrusives with associated gold and/or copper mineralization occur along a 5 km trend of skarn altered sediments on the Northwest part of the Zinger Property. The PGC and Gar North targets occur in low topography covered by overburden and alluvium with no known bedrock or surface expression. The Gar North target is oriented along a major syncline fold axis.

Geology map of Gar granitic intrusive area with gold in rock grab samples

Approximate 1600 m long gold in soil anomaly over the Gar Intrusive with additional gold in soil anomalies over adjacent altered sediments

Bismuth in soil anomalies are locally coincident with gold in soils

Molybdenum in soil anomalies are locally coincident with gold in soils

Gar granitic intrusive sample with sheeted quartz vein, rock analysis 1365 ppb (1.36 g/t gold)

Magnified photo of visible gold in quartz vein in Gar intrusive

Magnified photo of visible gold in pyrite in quartz vein in Gar intrusive
Airborne Magnetic Survey identifies a possible gold bearing intrusion larger in size than the GAR intrusion that has gold mineralization in quartz veins. The GAR intrusive has limited rock exposure and the larger magnetic low target has less rock exposure than the GAR
Next Steps
South Target Area
Airborne geophysics has identified an area at depth where gold may be concentrated by the intersection of two phases of folding and cross faults. There is potential along the 6 km trend to discover multiple gold deposits. Rock units potentially favourable to host gold need to be mapped and projected to depth where the two phases of folding may intersect. These areas at depth should be targeted by drilling close to cross faults that have the greatest carbonate-sericite alteration.
Northwest Target AreaThe Gar, Gar North and PGC targets each cover large areas that have never been drilled. The PGC and North Gar targets occur entirely in areas of low topography covered with overburden and no known rock exposure. Airborne magnetotelluric and magnetic survey results along with follow-up mapping, prospecting and soil geochem are planned to help define targets to drill.